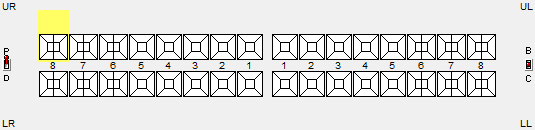
This area displays a graphical representation of the teeth in the patient’s upper and lower jaws, including Base Charting, Historical Charting and Planned Treatment. The Tooth Chart can be displayed in two modes:
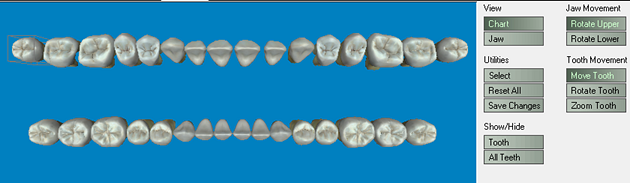
3D charting is explained in detail later in this document.
Planned treatment is shown by default in blue, but this colour can be customised in the Treatment Planning settings:
![]()
Completed treatment will be displayed in the colour defined in the Treatment Planning settings.
The Quick Chart Menu hovers over the chart as you move the mouse cursor over teeth:

The Treatment menu displays for the current tooth, listing both Historical and Current Treatments:

See also: Viewing tooth History from the Quick Chart Menu.