- Initial Examination: 1st Measurement
- Periodic: Annual Examination
- Recall: Maintenance
- Re-evaluation: 2nd Measurement.
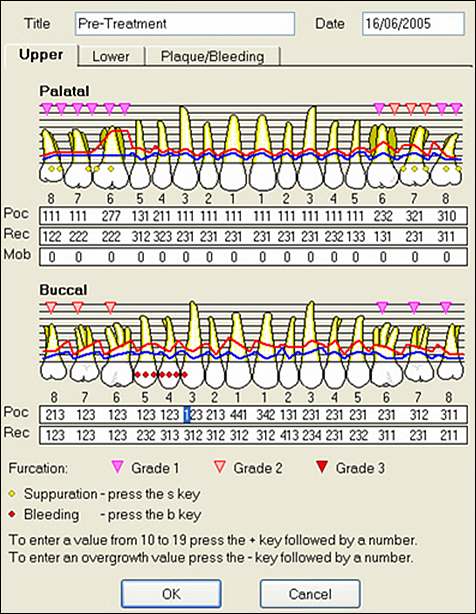
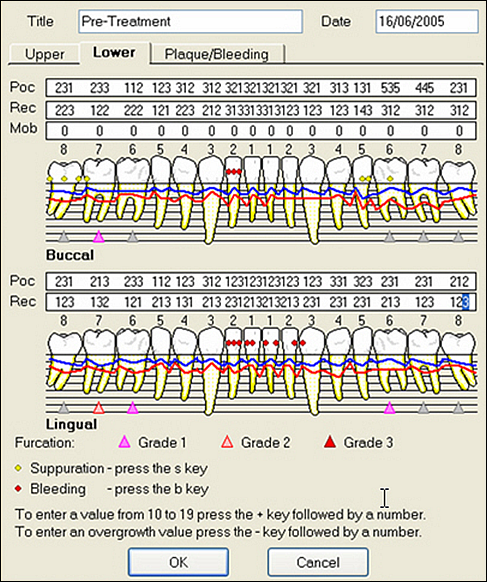
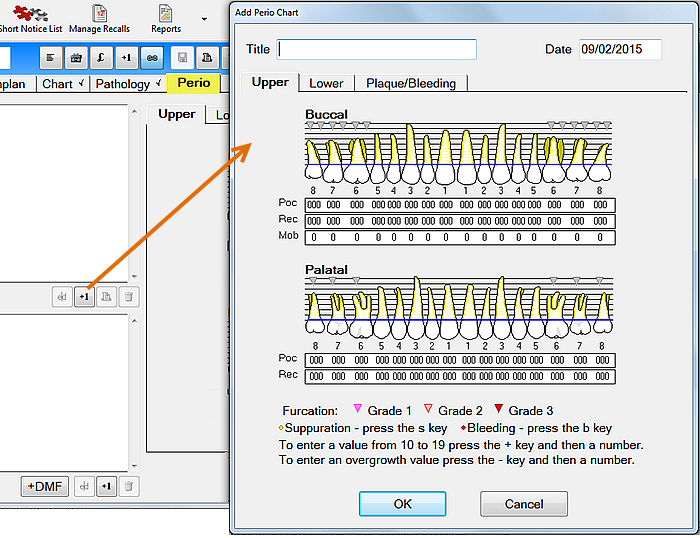
- Palatal Pocketing
- Gum Recession and Mobility
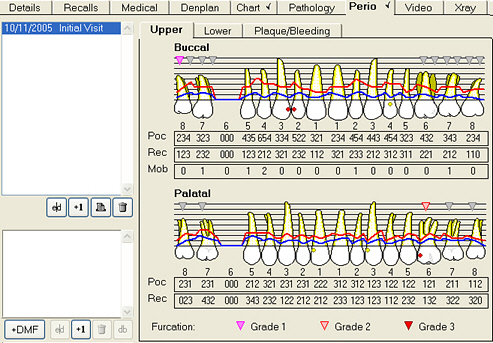
- Buccal Pocketing
- Gum Recession.
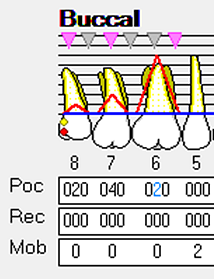
If you wish to chart a pocket greater than 9, select + followed by the number.
For example, a pocket of 10mm would be recorded as +0 and a pocket of 12mm as +2; this number would appear as a blue digit on the chart.
Example:
Mark any areas of Furcation and the severity by clicking on the triangles marking the areas. Click once (Grade 1), twice (Grade 2), or three times (Grade 3) .
Mark any areas of Suppuration by selecting either the Pocketing or Recession number at that location and pressing the S key ![]() on the keyboard.
on the keyboard.
Mark any areas of Bleeding similarly by selecting the location and pressing the B key ![]() .
.
To enter an overgrowth value, press the Minus key ![]() followed the number e.g. –3 to show an overgrowth of 3mm.
followed the number e.g. –3 to show an overgrowth of 3mm.