When a Provider logs in, EXACT by default reads the previous 12 months of data and calculates the percentage service usage by that Provider (which services are used the most frequently , scaled down to which are used the least frequently).
The Autofill facility enables automatic population of the most used services into both the Base (top) and Treatment (bottom) areas of the Quick Chart.
A new provider has no services usage history, and therefore by default sees only 5 blank spaces on the Quick Chart Base and Treatment menus.
Once a Provider completes and charges (or TCs) some treatment plans, EXACT is able to calculate which services this Provider has used most frequently.
To check the percentage service usage
In the Configure Quick Chart Menu, user would now choose the "Recalculate List" for EXACT to check which services are used most often. Below screenshot shows a new Provider who has treated their first patient with 2 fillings (A and C). The Recalculate List button shows this now as 50% for each service. User then chooses "Auto Fill" to update these 2 services into their "Treatment" area of the QCM. Same process would be used for updating the Base tab. For practical application, the dentist would periodically go into Configure Quick Chart Menu (as needed) and choose "Recalculate List". The provider can always manually add services by double clicking or dragging them to the "rubber band" (stretch-able) QCM "grid
To Autofill the Quick Chart Menu
Autofill enables you to automatically populate the menus with the most commonly used services in the business, that are not already on the menu.
For new installations with no usage statistics:
For a completely fresh installation of EXACT, the software has no data to calculate, so will simply produce 5 empty boxes.
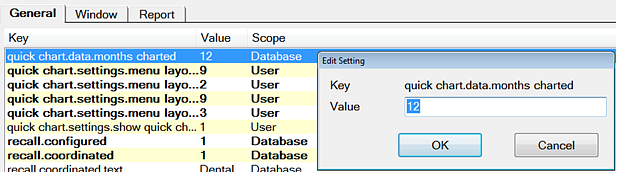
To customise the calculation period for autofill
Configure > Settings > quick.chart.data.monthscharted